Debugging (🟠WIP)
It is important to get familiar with some basic debugging tips as early as possible.
Graphics debugger
There is a particular challenge when it comes to graphics debugging: the usual debugging tools can only see what happens on the CPU, because that’s where they live.
We hence need a dedicated tool, called a graphics debugger. This debugger still runs on the CPU, but it gets injected between your application and the GPU command queue, and monitors everything that passes so that it can replay all your commands. Kind of a man-in-the-middle, if you will.
A graphics debugger really help a lot at debugging shaders, buffers, textures, etc. by enabling us to inspect the GPU memory and state. And it can also give performance hints.
I use two graphics debuggers:
RenderDoc is really great for debugging, it is actively and very accurately maintained.
Nsight Graphics also has a debugger, but I use it mostly for its frame profiler that gives detailed insights about the time spent by various GPU units.
Debugging textures
This first example of debugging is inspired by a real bug encountered by a reader[1] when following the texture loading chapter.
Clearly, something was wrong with the texture:
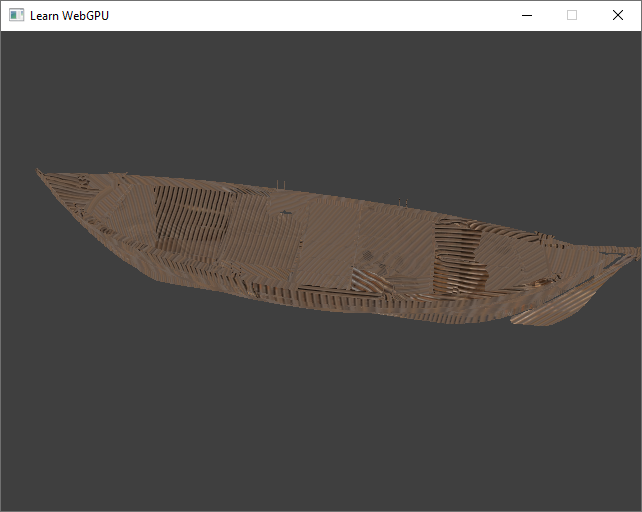
Something is wrong with the texture.
First reflex before touching at the code is to diagnose a little better the issue with RenderDoc. In the Launch Application tab of RenderDoc, browse to your application in Executable Path, maybe adapt the Working Directory if you load resources from relative paths, and you should see your program start with a debug overlay on the top:
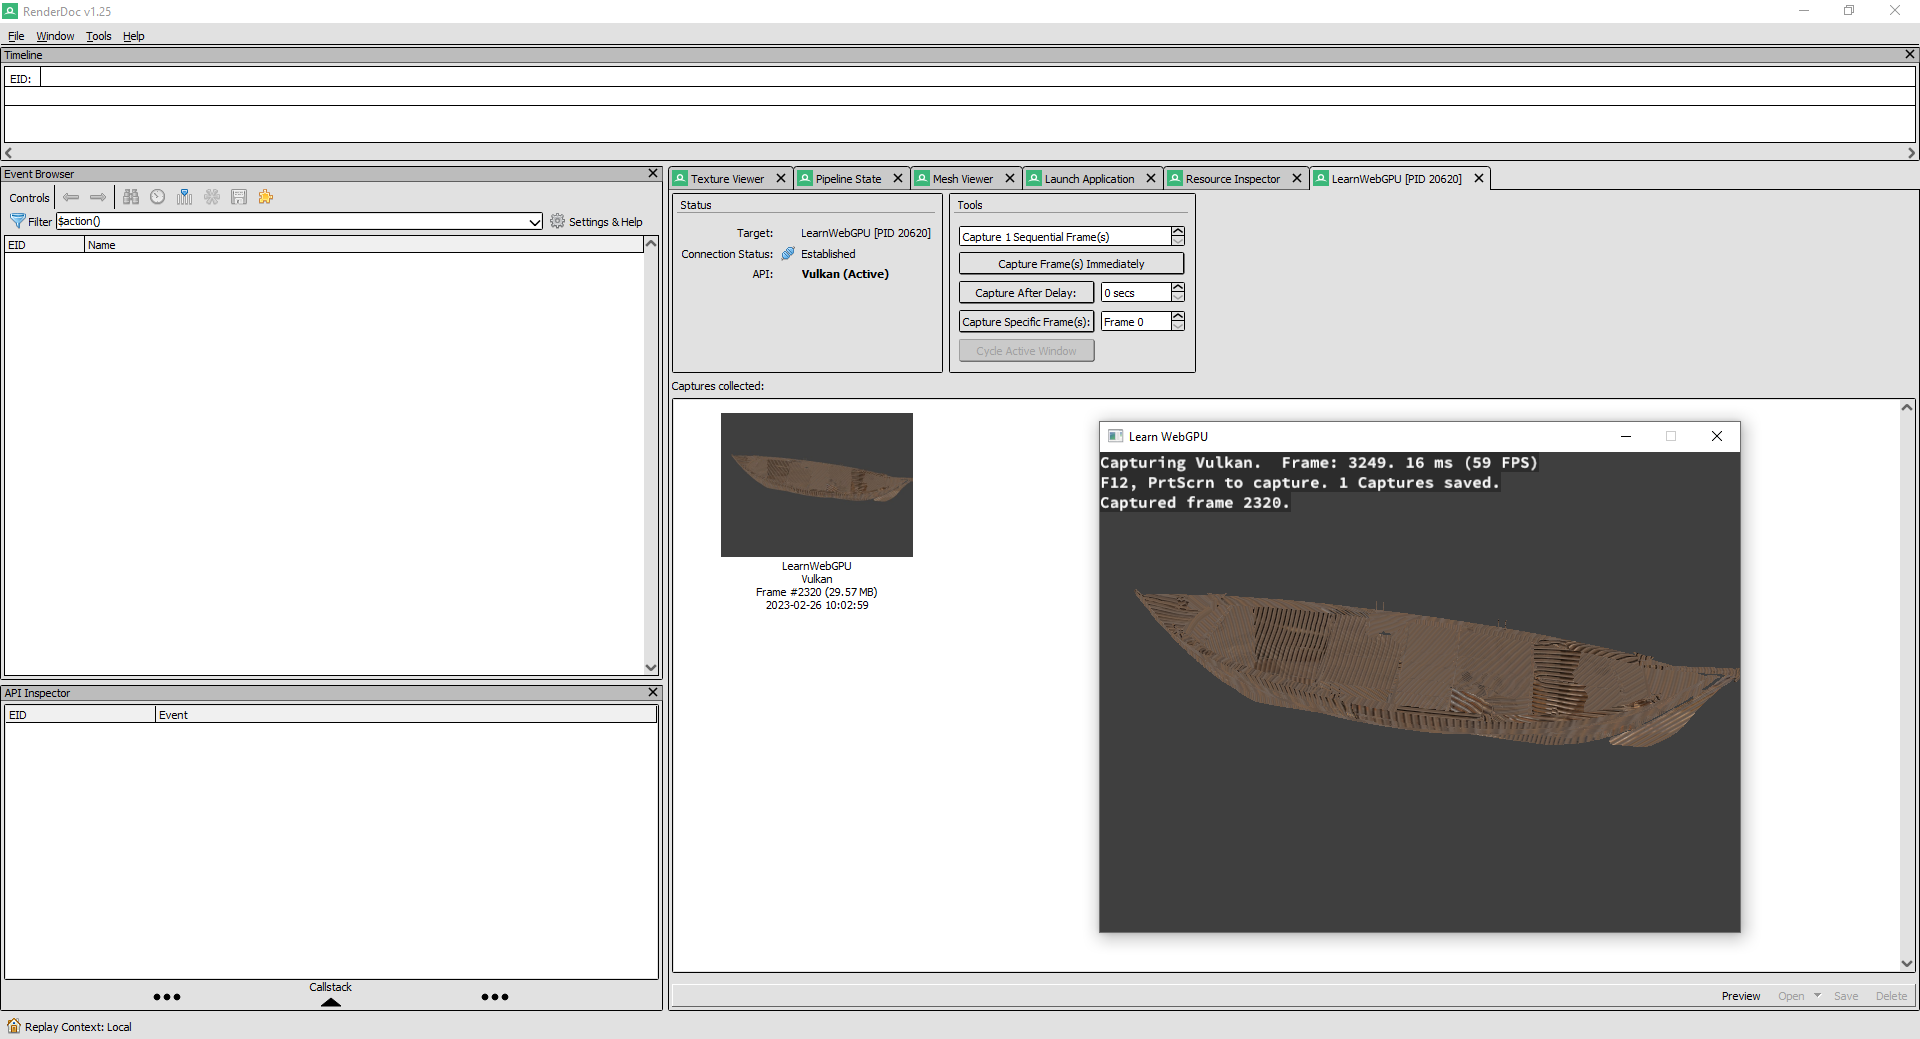
The application launched from RenderDoc.
This overlay confirms that RenderDoc was able to inject itself between your program and the GPU, and as it suggests, press F12 to capture a frame. This records everything that transits to the GPU and creates a Capture.
Note
You may then close your program, the capture contains everything it needs to replay your very frame.
Double click on the capture to open it. The Event Browser shows all the events (i.e., commands) that were intercepted by the debugger, and clicking on one goes to the state of the GPU as it was at that time. Locate for instance the main draw call:
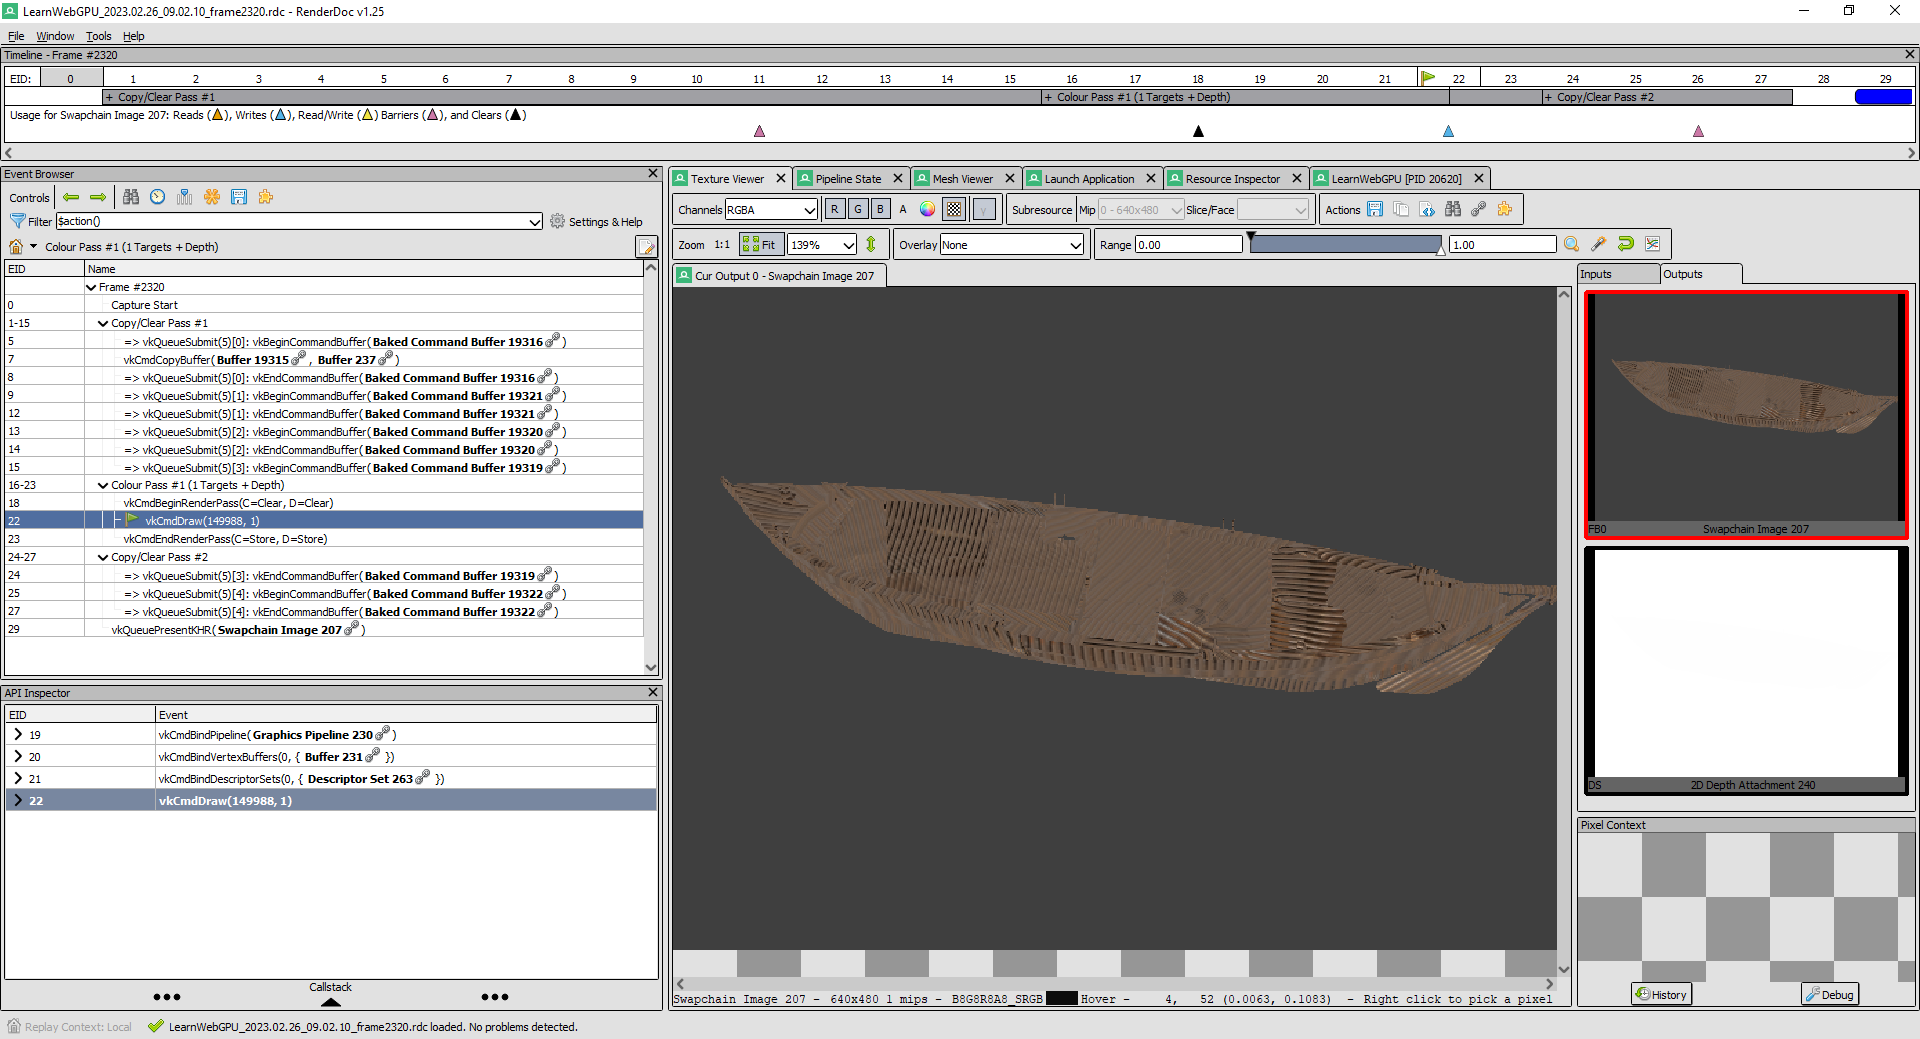
The list of events in RenderDoc.
You can use the Outputs tab of the Texture Viewer to help you navigate through the events.
Note
The captured events do not exactly match the WebGPU commands, because RenderDoc captures the low-level API that is hidden behind it. In my example, WebGPU runs on a Vulkan backend so what we see is Vulkan events. On a different platform, you may see a different API such as Metal or DirectX, but you should anyway recognize the overall structure.
Since something seems wrong the input texture, let’s go to the Inputs tab and look at it (make sure you are on the right draw call in the event browser):
The input texture inspected in RenderDoc.
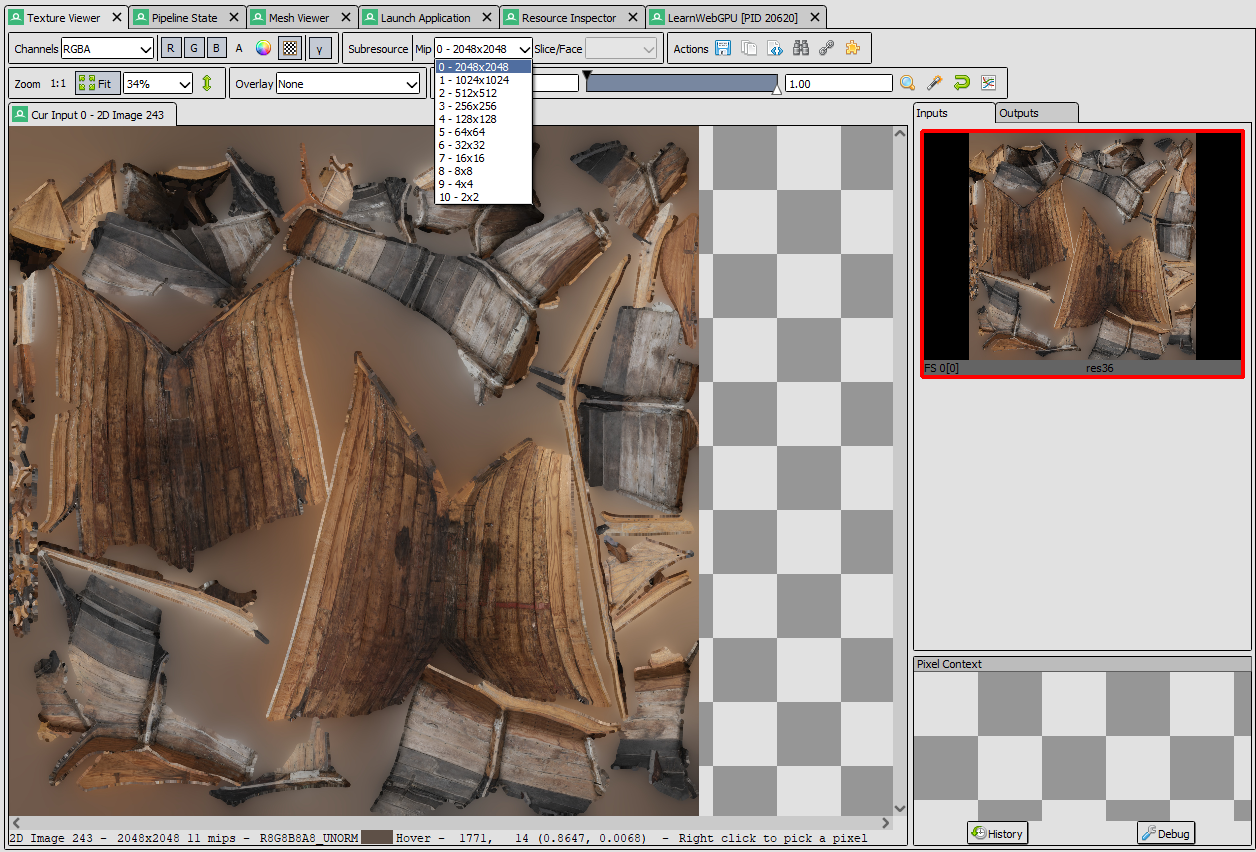
So far so good, so what is wrong? Mmh, let’s now inspect the different mip levels:
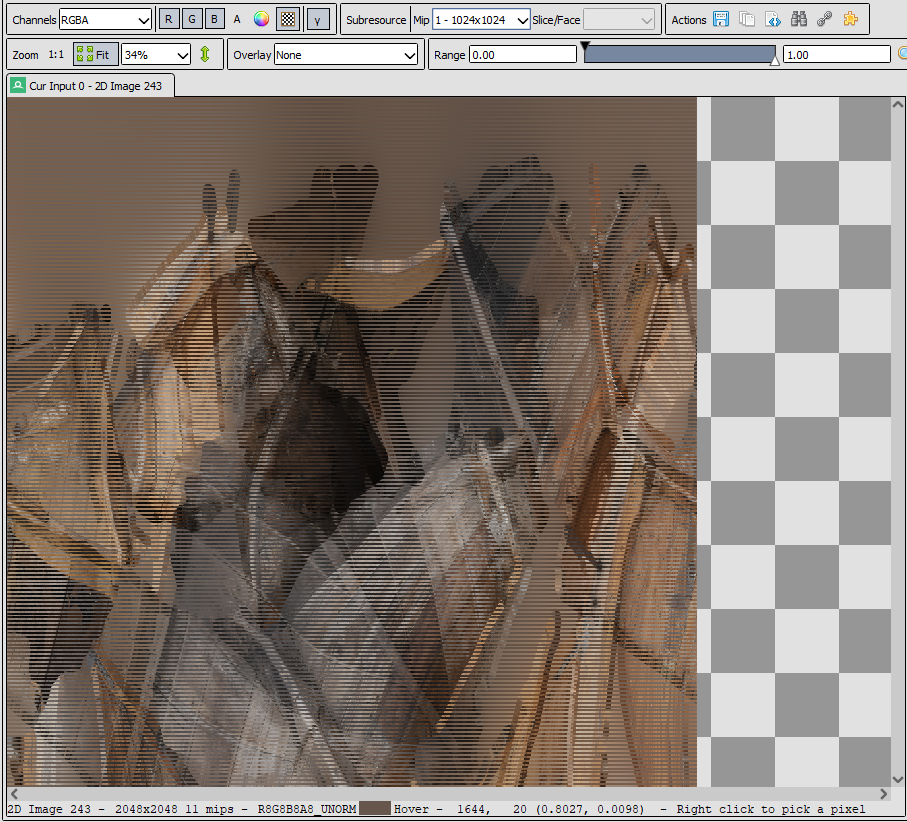
The mip levels inspected in RenderDoc.
Here we are, the mip levels are not built correctly! We now know that we should focus our debugging effort on the part of loadTexture that builds and upload the mip levels.
Note
As it turns out, the problem was that the writeTexture call was pointing to the original pixel buffer for all mip levels.
Debugging geometry
Another typical use case of RenderDoc is to inspect the geometry. And more generally, the Pipeline State tab gives precious information about draw calls:
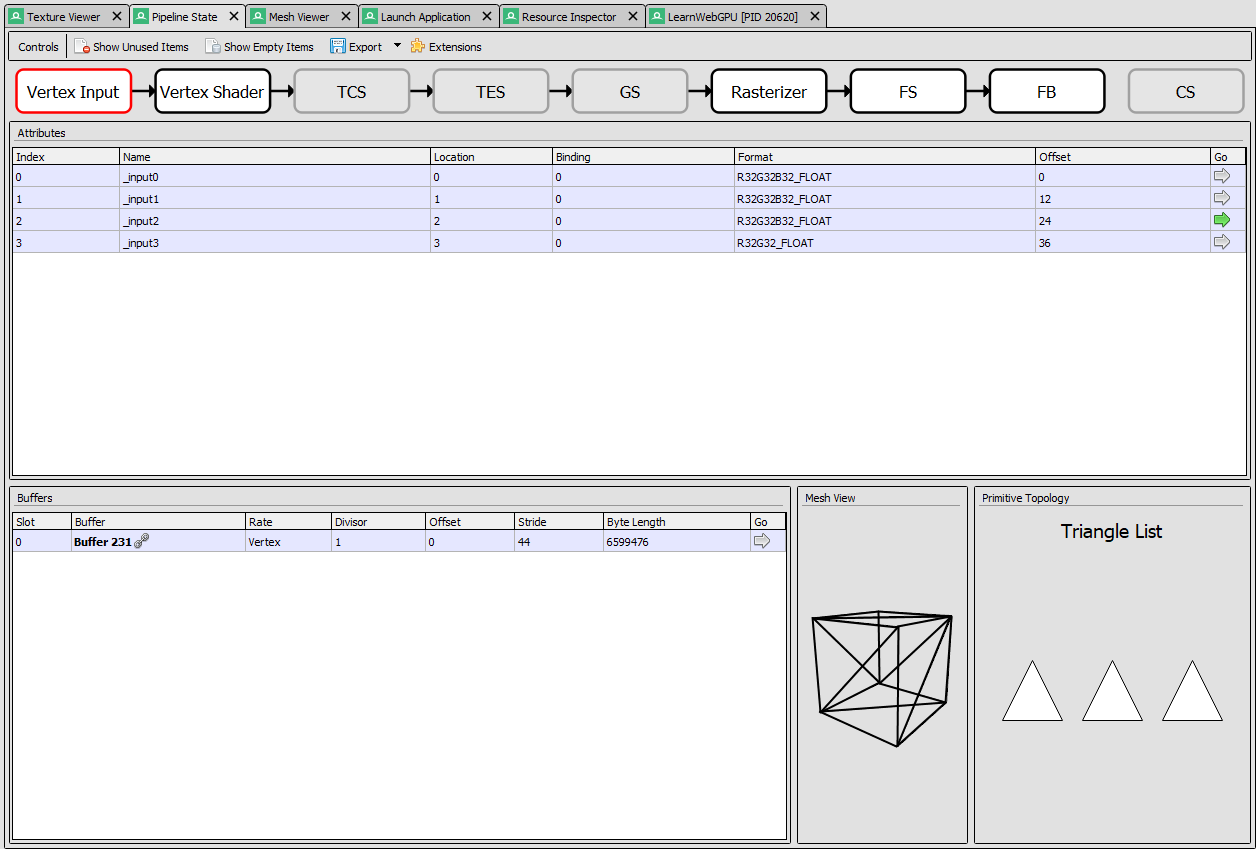
The graphics pipeline tab in RenderDoc.
We can see here the whole render pipeline, with both its fixed-function and programmable stages. In the Vertex Input stage, there is in particular a Mesh View that is very insightful:
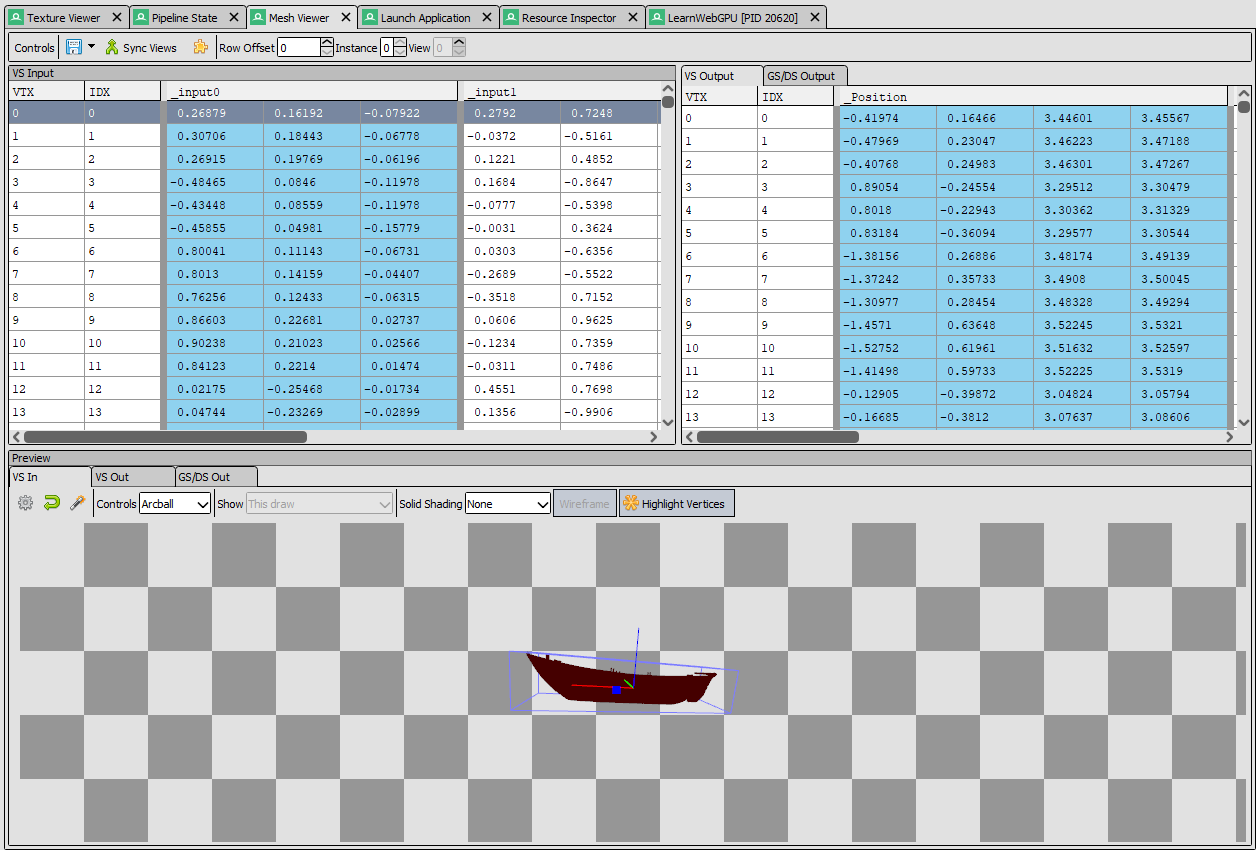
The mesh view in RenderDoc.
You can see, both as a table and in a 3D viewer, the assembled input geometry and the post vertex shader one.
Debugging in browser
If you are compiling your project as a web page using emscripten, you should check out the webgpu-devtools Chrome extension, it provides advanced WebGPU-specific debugging tools!