Dealing with errors 🟢
Resulting code: step018-next
😃 I did not have any trouble, I followed the wonderful instructions in previous chapters and it just worked!
Congrats, good for you! But as you’ll gradually want to experiment by yourselves, it is import to get familiar with the cases of error that can happen when playing with buffers.
Debugging a WebGPU error
In this chapter, we intentionally create errors in the result of previous chapters and see what error message it gives. This is a good practice when learning an API, so that we can then more easily recognize these messages later on, when they occur in more complex scenarios.
Wrong usage
A very typical issue is to forget about one of the usages of a buffer. Let us introduce an error by forgetting the CopySrc usage:
//bufferDescA.usage = WGPUBufferUsage_MapWrite | WGPUBufferUsage_CopySrc; // GOOD
bufferDescA.usage = WGPUBufferUsage_MapWrite; // BAD
If we run our program now, the uncaptured error callback that we have defined in The Device gets invoked twice:
Uncaptured error in device 00000058E3F3F1A0: type 2 ([Buffer "Buffer A"] usage (BufferUsage::MapWrite) doesn't include BufferUsage::CopySrc.
 - While validating source [Buffer "Buffer A"] usage.
 - While encoding [CommandEncoder "My command encoder"].CopyBufferToBuffer([Buffer "Buffer A"], 16, [Buffer "Buffer B"], 0, 32).
 - While finishing [CommandEncoder "My command encoder"].
)
Submitting command...
Uncaptured error in device 00000058E3F3F190: type 2 ([Invalid CommandBuffer "Command buffer" from CommandEncoder "My command encoder"] is invalid.
 - While calling [Queue "The Default Queue"].Submit([[Invalid CommandBuffer "Command buffer" from CommandEncoder "My command encoder"]])
)
Note
The very format of error message varies with the implementation. Here I report what I get using Dawn.
Reading error messages
In general, always investigate the first error first. In all likelihood, the other errors are consequences of the first one. Let’s focus on that first one then, and let me recall the content of our error callback:
// Content of our error callback:
std::cout
    << "Uncaptured error in device " << device << ": type " << type
    << " (" << toStdStringView(message) << ")"
    << std::endl;
The first thing that comes is the device pointer 00000058E3F3F1A0. We only have a single device anyways, so it is not that useful in our case.
Then comes the error type, which is just “2”. Not very informative, until we inspect the definition of the WGPUErrorType enum in webgpu.h:
// The enum WGPUErrorType as defined in webgpu.h
enum WGPUErrorType {
    WGPUErrorType_NoError = 0x00000001,
    WGPUErrorType_Validation = 0x00000002,
    WGPUErrorType_OutOfMemory = 0x00000003,
    WGPUErrorType_Internal = 0x00000004,
    WGPUErrorType_Unknown = 0x00000005,
    WGPUErrorType_Force32 = 0x7FFFFFFF
};
Note
You may want to write a utility function that maps each value to a string name of the error type. Later in this guide I introduce magic_enum which does that automatically for any enum.
Here we have a validation error (2). This means that what we are trying to do is not the correct use of the API, and this is something that the WebGPU implementation (Dawn, wgpu-native, etc.) checks to prevent you the trouble of the cascade of unintended consequences that it could have in lower level layers.
Lastly, and this is the most helpful part, we have the error message. In Dawn, the error message reads top down to go from the specific issue to the broader context in which the error occurred. The first lines (the specific one) is already quite helpful:
[Buffer "Buffer A"] usage (BufferUsage::MapWrite) doesn't include BufferUsage::CopySrc.
Note
The name "Buffer A" here comes directly from us, it is the label we have assigned to the buffer that is causing trouble. Always label your objects, it will save you a lot of time!
The message is quite clear: the usage we declared, namely (BufferUsage::MapWrite), does not include CopySrc. Why does this matter? The context lines bellow tell us why!
The error happens because we WebGPU tries to validate the usage of the buffer that we use as the source of a CopyBufferToBuffer operation:
- While validating source [Buffer "Buffer A"] usage.
- While encoding [CommandEncoder "My command encoder"].CopyBufferToBuffer([Buffer "Buffer A"], 16, [Buffer "Buffer B"], 0, 32).
- While finishing [CommandEncoder "My command encoder"].
Nice and helpful! And again, naming things really helps.
🤔 But I don’t remember where I call this
CopyBufferToBuffer. Or maybe this happens multiple times in my program and I don’t know which one is causing the issue…
There is a solution to that, let’s go further with debugging then!
Investigating the call stack
The error handler is a function that we wrote ourselves and that lives in our code. The good thing about this is that we can then use breakpoints to get insights about the execution of our program at the time of the error.
Tip
I strongly encourage you to always set up a breakpoint in your device’s uncaptured error callback.
In a visual IDE, adding a breakpoint is typically done by clicking in the margin of the source code view (see screenshot below). You can also use command line debuggers (e.g., gdb), in which case you must type in the file name and line number where to break.
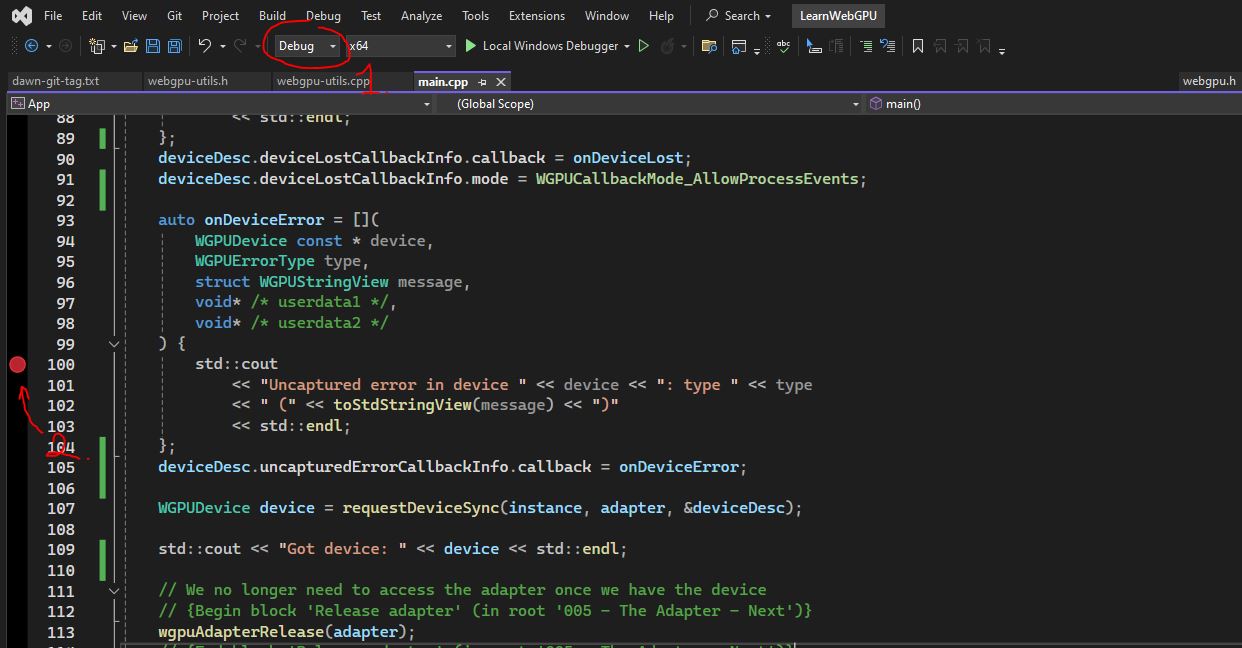
Once debugging symbols are enabled (1), we can use breakpoints (2) to inspect our program’s state whenever there is an error.
Note
The screenshots used here demonstrate debugging with Visual Studio, but all major C++ IDEs and debugger provide the same concept of breakpoint and call stack. Refer to your IDE’s documentation for more details.
To enable debugging symbols with build tools that do not support multiple Debug/Release configuration (e.g., make, ninja), you must configure your build with the -DCMAKE_BUILD_TYPE=Debug option when invoking CMake.
Once you have a breakpoint, run your program as usual, and it should automatically pause when the execution process reaches the line with a breakpoint. Once this is the case, you can inspect the call stack that gives information about the context of the error:
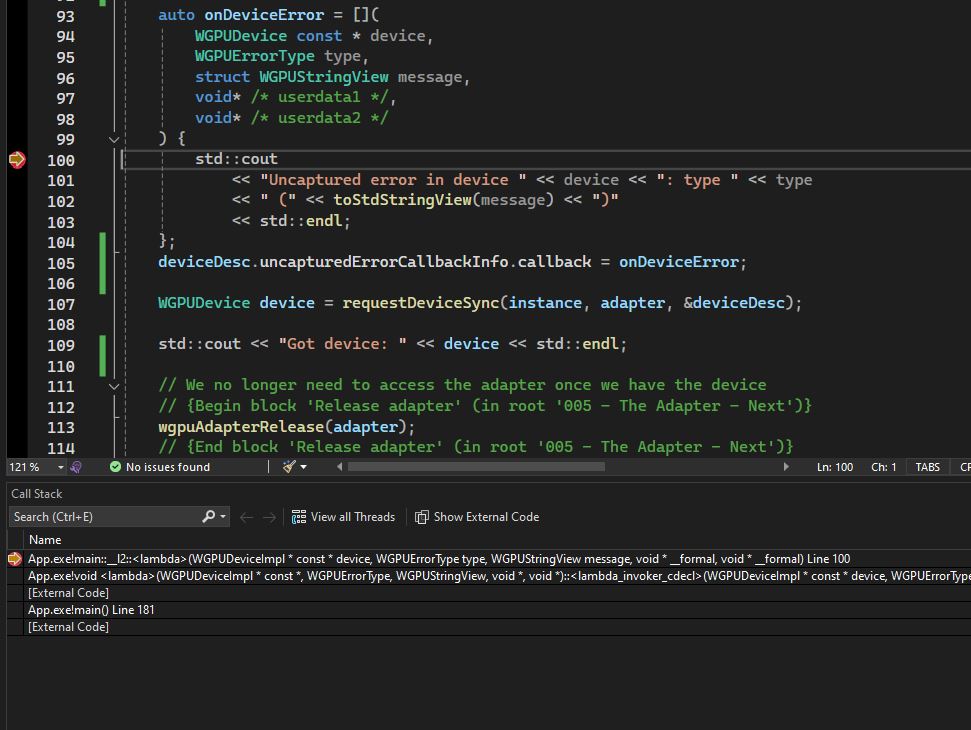
When our application reaches the breakpoint, it pauses and the IDE displays the current call stack and the current value of variables.
Visual Studio
If you do not find the Call Stack panel in Visual studio, go to “Debug > Windows > Call Stack”.
Here again, the stack reads top-down to go from specific to generic. The top-most row is the very line of your breakpoint, the next one tells you what function call led you here, and what parent call led you to that call, and so on.
In my screenshot above, we see that the breakpoint is located inside a lambda function (the onDeviceError lambda we passed to the device descriptor), which is called by some [External Code] (namely internal bits of the WebGPU implementation, which was built without debug symbols so it’s just called “external code”), which is in turned called by line 181 in my main() function.
Going to that line (double clicking on the row in the call stack may quickly take you there), we finally locate the guilty line of code!
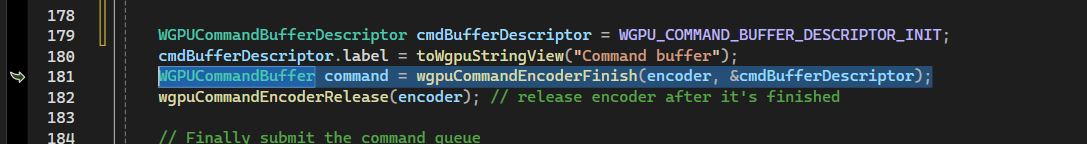
We found the very line of code that triggered the error!
As you can see, the error that triggered the failed buffer usage verification is a call to wgpuCommandEncoderFinish(). This exactly matches the bottom-most line of the WebGPU error message! Overall, if we glue together the WebGPU error and the IDE call stack, we have a full view of the chain of events that led to our error.
Other examples
Accessing a buffer that is not mapped
Okey, let is try a new intentional error: what if we forget to map the buffer A at creation, but still try to write into its content?
//bufferDescA.mappedAtCreation = true; // GOOD
bufferDescA.mappedAtCreation = false; // BAD
This time, no invocation of the uncaptured error callback. But no result neither: our program crashes! More specifically, it raises a segmentation fault with a message that may look like “Access violation writing location 0x0000000000000000”.
If you use a debugger or if you print in the console the content of your variables, you will realize that bufferDataA is a null pointer! Indeed, this is the way wgpuBufferGetMappedRange reports that it could not map the requested buffer (see documentation).
In this case, the error is not as clear as previously, so that is why we are doing this exercise of intentionally triggering errors. Remember that when wgpuBufferGetMappedRange returns a null pointer, you probably forgot to map it (or already unmapped it).
Wrong buffer bounds
Another example? Try messing up with the arguments of wgpuCommandEncoderCopyBufferToBuffer!
For instance, if I set a size that exceeds the length of the destination buffer (e.g., replace bufferDescB.size with bufferDescB.size + 10 as the last argument), my error callback gets invoked with the following message:
Copy range (offset: 0, size: 42) does not fit in [Buffer "Buffer B"] size (32).
 - While validating destination [Buffer "Buffer B"] copy size.
 - While encoding [CommandEncoder "My command encoder"].CopyBufferToBuffer([Buffer "Buffer A"], 16, [Buffer "Buffer B"], 0, 42).
 - While finishing [CommandEncoder "My command encoder"].
The error is clear since we correctly labeled our objects: the range we are trying to copy does not fit in the destination buffer B. And we know how to precisely locate the location of the error now, so we can easily fix it!
Failing to unmap a buffer
What if we forget to unmap buffer A before the copy?
//wgpuBufferUnmap(bufferA);
We get a clear error message:
[Buffer "Buffer A"] used in submit while mapped.
 - While calling [Queue "The Default Queue"].Submit([[CommandBuffer "Command buffer" from CommandEncoder "My command encoder"]])
Note that the error occurs while submitting the command buffer. It is totally possible to build this command buffer (using the command encoder) while the buffer is still mapped, what matters is that it is no longer mapped when the instructions are actually sent to the device.
Wrong limits
If you still display the device limits like we did in chapter The Device, you can see that there is one called maxBufferSize. Its default value is \(268,435,456\), which corresponds to 256MB (\(256 \times 1024 \times 1024\)), and this is what you should see because we did not ask for specific limits, so we automatically get the default.
Tip
You can find the default limits in Section 3.6.2. of the official WebGPU Specification.
So, let us try and exceed that limit! What about asking for a 512MB buffer:
//bufferDescA.size = 256; // GOOD
bufferDescA.size = 512 * 1024 * 1024; // BAD, 512MB is more than the default limit
Again, we get a validation error with a pretty clear message (remember to read the first error first):
Buffer size (536870912) exceeds the max buffer size limit (268435456). This adapter supports a higher maxBufferSize of 1099511627776, which can be specified in requiredLimits when calling requestDevice(). Limits differ by hardware, so always check the adapter limits prior to requesting a higher limit.
 - While calling [Device "My Device"].CreateBuffer([BufferDescriptor ""Buffer A""]).
Interestingly, Dawn mentions here that although the logical device is limited to 256MB, the underlying adapter (hardware + driver) can support much more, so we could ask for a device with higher limits just before requesting the device:
// after WGPULimits requiredLimits = WGPU_LIMITS_INIT;
requiredLimits.maxBufferSize = 512 * 1024 * 1024;
Note
My adapter claims to support buffers of size 1024GB (1099511627776), which feels a bit optimistic, to say the least. I reported this in Dawn’s bug tracker, and invite you to do the same when you face something that you suspect to be a bug in Dawn.
And if the issue comes from this guide, report it to LearnWebGPU/issues on GitHub instead.
If you do not interrupt your program at the first error, you can see that it actually proceed without crashing. Instead, it keeps on giving insightful error messages: this is because the validation error did not prevent wgpuCreateBuffer from returning a WGPUBuffer object, only it returned one that is marked internally as invalid:
[Invalid Buffer "Buffer A"] is invalid.
 - While encoding [CommandEncoder "My command encoder"].CopyBufferToBuffer([Invalid Buffer "Buffer A"], 16, [Buffer "Buffer B"], 0, 32).
 - While finishing [CommandEncoder "My command encoder"].
Note
What we have done in the previous chapter is subject to many device limits. Some are related to the use of bindings and stage buffers:
maxBindGroupsis the maximum number of bind groups that can be used within the same pipeline (default: 4).maxBindingsPerBindGroupgives the maximum binding index that we can use within a bind group (default: 1000).maxStorageBuffersPerShaderStageis the maximum number of storage buffers that can be bound within the same shader stage (default: 8).maxStorageBufferBindingSizeis the maximum byte size of a storage buffer (default: 128 MiB).maxBufferSizeis the maximum byte size of a buffer in general (default: 256 MiB).
Some others are related to the maximum dimensions of the compute shader grid:
maxComputeInvocationsPerWorkgroupis the maximum number of thread in a workgroup (default: 256).maxComputeWorkgroupSizeX(and same forYandZ) limits this number in a given dimension (default: 256 forXandY, 64 forZ).maxComputeWorkgroupsPerDimensionis the maximum number of workgroups that can be invoked along each dimension, i.e., the arguments ofwgpuComputePassEncoderDispatchWorkgroups()(default: 65535).
Conclusion
Nothing new in the codebase after this chapter, but very valuable knowledge in our heads to help us face more intricate scenarios: we are now ready to run our first shader!
Note
To learn more about error handling in WebGPU, you can consult the dedicated article in the official documentation of the WebGPU C API.
Resulting code: step018-next